otto monitor
otto monitor launches an interactive performance dashboard that collects
CPU, memory, disk, and network metrics from remote hosts in real time.
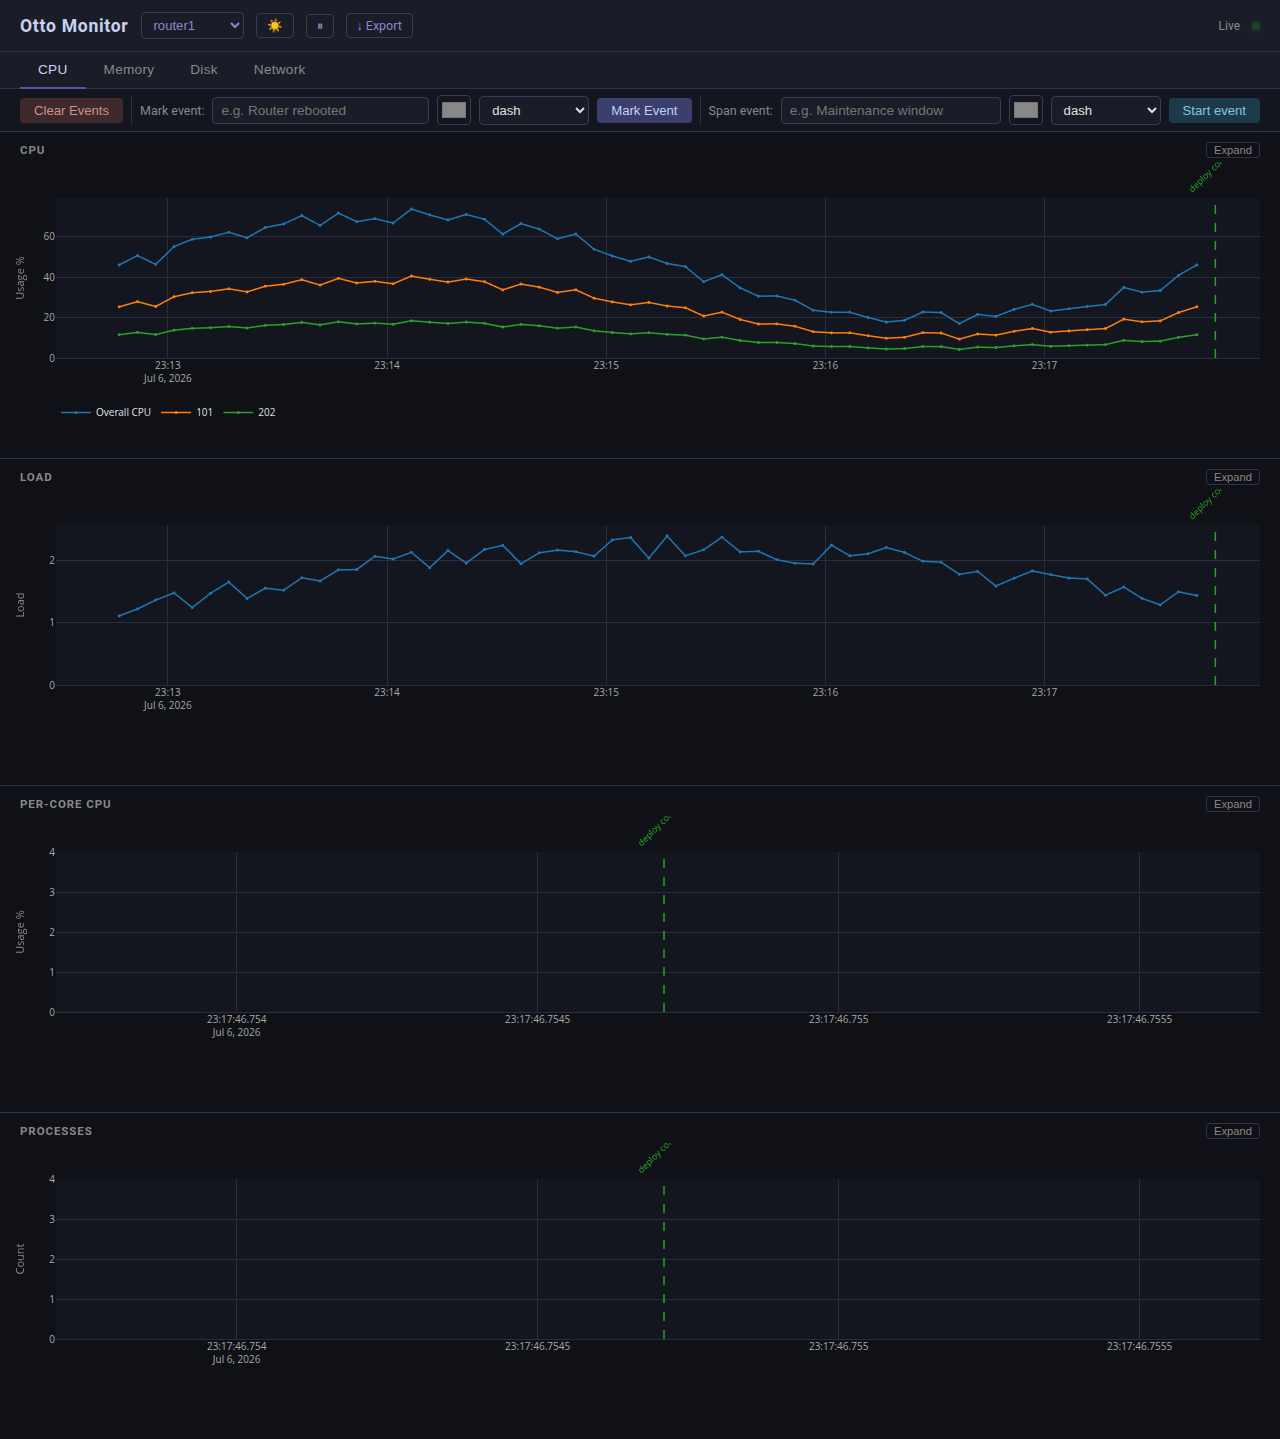
Charts extend in place as new samples stream in over SSE, and events mark moments on the shared timeline:
Live mode
By default, otto monitor polls every real host in the lab:
otto --lab my_lab monitor
Docker container hosts are excluded — they aren’t operated on as part of
the host fleet. Embedded targets without an snmp block are also
excluded: the monitored set is Unix hosts (shell metrics) plus any host
that declares snmp (polled over SNMP — see
SNMP monitoring below).
Selecting hosts
Pass a regex to --hosts (matched against host IDs via re.search) to
narrow the live host set:
otto --lab my_lab monitor --hosts 'router|switch'
otto --lab my_lab monitor --hosts router1
Omit the option to monitor every real host in the lab (Docker containers excluded).
Collection interval
Control how often metrics are collected with --interval (default: 5
seconds, minimum: 1 second):
otto --lab my_lab monitor --interval 2.0
Persisting data
Use --db to write collected metrics to a SQLite file for later viewing:
otto --lab my_lab monitor --db metrics.db
Running otto on shared/NFS storage
otto is safe to run with its log/artifact root (OTTO_XDIR) on a shared mount
(NFS, CIFS/SMB, sshfs, …):
Monitor database. SQLite’s WAL journaling is not supported over a network filesystem, so when the
--dbpath is on one otto automatically uses theDELETEjournal mode instead (logged at debug level). This is transparent and lossless for monitoring’s write pattern.Multi-machine, one shared database. The “another instance is already writing” guard relies on
flock, whose semantics on network filesystems are same-host only. If several machines may write to the same database file, put that database on local disk (or give each machine its own--dbpath).Logs and artifacts. Per-run log directories are fine on shared storage. Old-log rotation is wall-clock budgeted, so even a very large log tree cannot stall a run — any backlog is pruned across subsequent runs.
Lab data and settings (
hosts.json,.otto/settings.toml) are read once per run and are unaffected.
If otto cannot determine the filesystem type, it assumes local disk and keeps its default behaviour.
Historical mode
View previously collected data by passing --file:
otto --lab my_lab monitor --file metrics.db
otto --lab my_lab monitor --file metrics.json
Supported formats: .db (SQLite) and .json.
Web dashboard
In both modes, otto serves an interactive web dashboard. The server binds
an OS-assigned free port and logs the dashboard URL at startup (Server running at http://<ip>:<port>, one URL per non-loopback interface). The
dashboard shows:
Live metric graphs (CPU, memory, disk, network)
Timeline with events
Per-host breakdowns
Frontend development
The dashboard’s frontend is a React + Vite + TypeScript single-page app in
web/. Vite builds it into src/otto/monitor/static/dist/, the only
frontend MonitorServer serves — there is no
legacy fallback, so a checkout without a build fails loudly with a
make web pointer rather than silently serving something stale.
make web-install   # npm ci, from web/package-lock.json
make web-dev       # Vite dev server with hot reload; proxies /api to a
                    # running `otto monitor` (default http://127.0.0.1:8080,
                    # override with VITE_OTTO_TARGET=http://host:port)
make web           # production build: regenerates + diffs the generated
                    # wire types against the live pydantic models, builds,
                    # then gates the output against absolute http(s) URLs
                    # (labs are air-gapped)
make web-test      # vitest — store reducers, SSE handling, chart-series
                    # grouping, PID-trace retirement, etc.
Point make web-dev at a live otto monitor (or a --file replay) for the
fast edit/reload loop; make web is what actually ships in the wheel.
DOM-parity contract. tests/e2e/monitor/dashboard/ is a Playwright suite
that pins the dashboard’s observable surface — element ids and classes,
Plotly trace/layout internals, status text, localStorage keys — the
contract the frontend was ported to React against. Those pins adjudicate,
not this page or the source: if a doc description and a pin ever disagree,
fix the doc. Run them locally with make dashboard (Chromium only — the fast
per-task check; needs make browsers once) or make dashboard-all for the
full cross-engine matrix: Chromium (Blink), Firefox (Gecko), and WebKit
(Safari). The one Safari-specific test runs on WebKit only via
@only_browser("webkit"). make release runs all three; CI runs them as a
parallel per-engine matrix.
Monitoring during a test run
Pass --monitor to otto test to collect metrics for the entire run.
Per-test start/end events are emitted automatically and the captured
data is written to <output_dir>/monitor.json at exit:
otto --lab my_lab test --monitor TestPerformance
otto --lab my_lab test --monitor --monitor-interval 2 --monitor-hosts router TestPerformance
otto --lab my_lab test --monitor --monitor-output run.db TestPerformance
Reload a captured run in the dashboard via otto monitor --file <path>.
Monitoring from test suites
You can also start the monitor programmatically from within a single test:
class TestPerformance(OttoSuite[_Options]):

    async def test_load(self, suite_options: _Options) -> None:
        await self.start_monitor(hosts=[host1, host2])
        await self.add_monitor_event("Load started", color="green")

        # ... run workload ...

        await self.add_monitor_event("Load complete", color="red")
        await self.stop_monitor()
When both per-suite and --monitor-driven session collectors are active,
the per-suite collector takes precedence for that test. Events appear as
markers on the dashboard timeline, making it easy to correlate metric
changes with test actions.
Built-in metrics
Every Unix host in the monitored set runs DEFAULT_PARSERS unless a custom
registration says otherwise (see Custom parsers below):
Command |
Series |
Chart |
Tab |
Notes |
|---|---|---|---|---|
|
Overall CPU; |
CPU |
CPU |
Runs two |
|
Memory Usage; Swap |
Memory Usage |
Memory |
The Swap series only appears when the host has swap configured — it is omitted, not charted as a flat 0. |
|
one series per mounted filesystem, labelled by mount point |
Disk Usage |
Disk |
|
|
Load (1m), Load (5m), Load (15m) |
Load |
CPU |
|
|
|
Network I/O |
Network |
Loopback ( |
|
Established, Time-wait |
Sockets |
Network |
A host without |
|
|
Disk I/O |
Disk |
Whole devices only — partitions ( |
|
|
Per-core CPU |
CPU |
The aggregate line is skipped; overall CPU is already charted by the top-CPU parser above. |
|
Runnable, Total procs, Blocked |
Processes |
CPU |
Network I/O and Disk I/O are rate metrics: computed from monotonic counter deltas, they need two samples before they can chart anything, so the first tick for a given interface or device emits no point. A host reboot resets those counters; otto detects the resulting negative delta, skips one tick, and re-baselines from the new counters — a reboot never shows up as a spike.
Custom parsers
The monitor uses parsers to extract metrics from command output. By default,
all hosts use DEFAULT_PARSERS. Subclass MetricParser and implement
parse(self, output, *, ctx) to extract one or more data points from a
command’s raw output, then register it for specific hosts:
from otto.monitor.collector import MonitorTarget
from otto.monitor.parsers import DEFAULT_PARSERS, MetricDataPoint, MetricParser, ParseContext


class NvidiaGpuParser(MetricParser):
    y_title = "Usage %"
    unit = "%"
    chart = "GPU"
    command = "nvidia-smi --query-gpu=utilization.gpu --format=csv,noheader,nounits"

    def parse(self, output: str, *, ctx: ParseContext) -> dict[str, MetricDataPoint]:
        return {self.chart: MetricDataPoint(value=float(output.strip()))}


MonitorTarget(
    host=gpu_host,
    parsers={
        **DEFAULT_PARSERS,
        NvidiaGpuParser.command: NvidiaGpuParser(),
    },
)
ctx (a ParseContext) carries tick-local
input such as the target host’s core count; most parsers ignore it. See
otto.monitor.parsers for the built-in parsers and the
MetricParser protocol.
Per-host parsers
Register a custom parser dict for one host — or a family of hosts matched by
a compiled regex — from an init module listed in .otto/settings.toml.
Registration matches on the host id (the unique key, as in lab.hosts),
not the human-readable display name shown in the dashboard:
from otto.examples.monitor import UptimeParser
from otto.monitor.parsers import DEFAULT_PARSERS, register_host_parsers

register_host_parsers(
    "router1",
    {**DEFAULT_PARSERS, UptimeParser().command: UptimeParser()},
)
UptimeParser (in otto.examples.monitor) is a complete, runnable example:
it charts cat /proc/uptime as a single “Uptime” series in seconds, and
otto’s own test suite registers it exactly this way.
A compiled pattern instead of a host id scopes the same registration to
every host whose id matches — for example, giving a family of busybox-*
hosts (whose ss doesn’t support -s) a netstat-based sockets parser in
place of the default ss -s one:
import re

from otto.monitor.parsers import DEFAULT_PARSERS, register_host_parsers
from my_repo.parsers import NetstatSocketsParser  # your own ss-free implementation

parsers = {k: v for k, v in DEFAULT_PARSERS.items() if k != "ss -s"}
parsers[NetstatSocketsParser.command] = NetstatSocketsParser()
register_host_parsers(re.compile(r"busybox-.*"), parsers)
Patterns are matched with re.fullmatch against the host id. Precedence is
exact id > pattern > project-level > DEFAULT_PARSERS: an exact-id
registration always wins outright for that host, and a host matched by two
different patterns raises at resolution time rather than picking a silent,
import-order-dependent winner.
Project-level parsers
Register parsers that apply to every monitored host from an init module
(listed in .otto/settings.toml):
from otto.monitor.parsers import register_parsers
from my_repo.parsers import SocketParser

register_parsers([SocketParser()])
A parser whose command matches a built-in overrides it; new commands
extend the set. Per-host registrations (register_host_parsers) still take
total precedence for their host. Registering the same command twice raises.
Per-parser collection intervals
Set interval (seconds) on a parser class to poll its command on its own
cadence; parsers without one use the global --interval:
class SocketParser(MetricParser):
    command = "ss -s"
    interval = 30.0  # poll sockets every 30s regardless of --interval
    ...
Parser health
The collector watches each parser’s command for two kinds of trouble and logs a warning — edge-triggered, so a flapping command logs every transition while a steady outage logs only once.
Failing command. The first tick a command starts failing (nonzero exit) logs a warning naming the metrics that will be missing; recovery logs once more when the command starts succeeding again:
Monitor: 'ss -s' failed on test1 (exit 127): ss: command not found — Sockets metrics will be missing
Monitor: 'ss -s' recovered on test1 after 4 failed tick(s)
Silent command. A command that keeps exiting 0 but never yields a data point — a bad regex, an unfamiliar output format, nothing to report — gets a one-time backstop warning after three succeeding ticks with no output:
Monitor: parser SocketsParser ('ss -s') has produced no data on test1 after 3 ticks
Only succeeding ticks count toward those three; a failing command is already covered by the warning above and isn’t double-counted here. The same backstop watches SNMP OIDs that never return a value.
Either way, a missing tool or unreachable metric is not an error otto tries to recover from: the affected series is simply absent from the dashboard, same as any other tick that produced no data.
Log-sourced data
Some systems don’t expose live values through a poll-able command: a cron
job digests performance counters into a timestamped file every few
minutes, or the interesting record is a log file’s event stream rather
than a number. Both ride the same shell acquisition path as every other
parser — the command is the reduction step (cat/tail/awk/grep/jq
on the host ships back only the lines otto needs) — but instead of one
untimed value per tick, each row or line carries its own timestamp. The
design assumes source data is textually reducible on the host; binary or
otherwise irreducible formats are out of scope.
CSV metric files
CsvMetricParser charts a cron-digested
CSV file. Register it like any other parser (see Custom parsers):
from otto.monitor.log_sourced import CsvMetricParser
from otto.monitor.parsers import register_parsers

register_parsers([
    CsvMetricParser(
        "cat /var/log/perf/net.csv",
        columns=["rx_kbps", "tx_kbps"],
        chart="Cron net digest",
        tab="network",
        tab_label="Network",
        unit="kb/s",
        interval=60,
    ),
])
Line format: the first column is an ISO-8601 or epoch-seconds timestamp
(naive values are treated as UTC); the remaining columns are numeric
values matching columns, comma-separated, in file order. Header and
otherwise malformed lines are skipped outright. The final line of each
read is provisional rather than trusted immediately — a mid-write read
can torn-truncate it into something that still parses — so it only emits
once a later read shows it unchanged; worst case this delays the newest
row by one poll interval, and a torn line itself never emits (see
Timestamps below for the high-water mark this protects).
Because points carry their own data-carried timestamps rather than the collector’s tick time, a file already holding the last hour of digests backfills the dashboard and DB with a full hour of real history the moment monitor starts, not just whatever arrives after that.
One instance per file: the command string is the parser registry key, so
monitoring “a couple of CSV files” means two registered instances. Give a
slow-cadence file its own interval (seconds; see
Per-parser collection intervals) so
otto doesn’t re-read an unchanged file on every tick.
A cron job maintaining such a file might look like this:
#!/bin/sh
# Example cron digest: append "epoch,val1,val2", prune to the last hour.
# Cron entry (every 5 minutes):  */5 * * * *  root  /usr/local/bin/perf_digest.sh
FILE=/var/log/perf/net.csv
printf '%s,%s,%s\n' "$(date -u +%s)" "$(cat /sys/class/net/eth0/statistics/rx_bytes)" \
    "$(cat /sys/class/net/eth0/statistics/tx_bytes)" >> "$FILE"
tail -n 12 "$FILE" > "$FILE.tmp" && mv "$FILE.tmp" "$FILE"   # 12 lines = 1 h at 5-min cadence
Provisioning a script like this on a bed is a manual demo step — otto’s own
test suite exercises CsvMetricParser entirely against fixture-written
files, never a live cron job.
Log-event tables
RegexLogEventParser turns matching log
lines into table rows instead of chart points. A worked syslog example,
using the same pattern otto’s own test suite registers:
from otto.monitor.log_sourced import RegexLogEventParser
from otto.monitor.parsers import register_parsers

SYSLOG_PATTERN = r"^(?P<ts>\S+) (?P<loghost>\S+) (?P<proc>[^:\[]+)(?:\[\d+\])?: (?P<message>.*)$"

register_parsers([
    RegexLogEventParser(
        "tail -n 200 /var/log/syslog",
        SYSLOG_PATTERN,
        tab="syslog",
        tab_label="Syslog",
    ),
])
Every named group in pattern besides the timestamp group becomes a table
column, in pattern order (loghost, proc, message above). A line that
doesn’t match is skipped entirely — a wrong pattern therefore produces zero
rows ever, which the Parser health silent-command
backstop surfaces by the third tick.
ts_group (default "ts") names the group holding the timestamp;
ts_format (default "iso") tells parse_timestamp how to read it:
"iso" for ISO-8601, "epoch" for Unix epoch seconds, or anything else as
a strptime format. Classic syslog timestamps (Jan 2 15:04:05, no year)
need a strptime format — otto injects the current UTC year before
parsing those, so they parse correctly instead of rejecting outright. If
that injected year would land the row more than 2 days in the future (a
Dec 31 line read just after New Year rolls over to next year’s Jan 1
under the current-year injection), otto subtracts one year — the standard
syslog-consumer rollover guard, so a New Year boundary can’t wedge the
high-water mark a year ahead of every real row.
Each RegexLogEventParser contributes one kind="table" tab on the
dashboard and no chart. Rows render newest-first with a client-side,
case-insensitive substring filter; the browser keeps roughly the last 500
rows on screen even though the database keeps every row ever collected —
reload that database with --db (see Historical mode)
and the full history replays as a table too, not just as charts.
Table parsers must declare their own tab id: a table tab can’t share an
id with a chart tab, or with another table tab (see
TabSpec). Registering a colliding tab id is a
configuration error that otto raises loudly rather than silently picking a
winner.
LogEvent rows are a deliberately separate
data path from MonitorEvent markers: log
events are per-host, high-volume, columnar table data, while
MonitorEvents are the global, low-volume annotations that mark moments
on the chart timeline (see
Monitoring from test suites).
Timestamps
Every log-sourced row carries its own data-carried timestamp instead of the collector’s tick time; a naive value (no timezone) is always treated as UTC, whether it comes from a CSV’s first column or a regex’s timestamp group. A row with no parseable timestamp is dropped — log-sourced parsers have no tick-time fallback, so an empty or unrecognized timestamp field means that row never appears at all.
Each parser instance keeps a high-water mark: the newest row timestamp it
has emitted so far. Re-reading a rolling window (the usual tail -n N)
drops everything at or below the mark, so ticks that overlap the previous
read are deduplicated rather than double-counted. The mark is keyed on the
row’s own timestamp, not a file offset or byte count, so log rotation and
truncation need no special handling — a rotated file’s new rows are still
newer than the mark and come straight through.
Large files
An append-only log fits at any size: a fixed tail -n N window bounds
what one tick reads, and the high-water mark discards whatever overlaps
the previous read, so N only needs to comfortably cover one poll
interval’s worth of new lines, not the file’s total size.
Because a parser’s command string is a static registry key, one parser
can’t vary its command per tick — reading from a byte offset that grows
over time, for example, is unsupported by design; size tail -n N to the
interval instead. A large regenerated file (a digest script that
rewrites the whole thing on every run rather than appending) fits the same
way any verbose command output does: reduce at the source with
awk/jq/a product CLI, and give the parser its own slower interval
(see Per-parser collection intervals)
if the file itself only changes infrequently — each parser rides its own
bucket, so a slow file never blocks faster ones.
SNMP monitoring
Some targets expose performance metrics over SNMP rather than via a shell interface. Otto supports SNMP v2c polling for any standards-compliant agent — a Zephyr device running otto’s test-bed agent, a Linux box running net-snmp, or network gear — on a separate channel from command execution.
When to use it
Use SNMP monitoring when a host either has no shell (embedded Zephyr targets) or
when you prefer to pull metrics through a dedicated management channel rather than
shell commands. See Embedded Hosts for embedded host setup and Lab Configuration
for the snmp field reference.
Configuring the snmp block in hosts.json
Add an snmp object to a host entry in hosts.json to enable SNMP collection
for that host:
{
    "ip": "192.0.2.1",
    "element": "sprout",
    "os_type": "zephyr",
    "snmp": {
        "address": "10.10.200.14",
        "port": 16101,
        "community": "public",
        "oids": [
            "1.3.6.1.2.1.1.3.0",
            "1.3.6.1.4.1.63245.1.1.0",
            "1.3.6.1.4.1.63245.1.2.0",
            "1.3.6.1.4.1.63245.1.3.0",
            "1.3.6.1.4.1.63245.1.4.0"
        ]
    }
}
The address and port are the endpoint reachable from the otto host — for
an embedded device behind a hop this is typically the local end of a UDP relay
on the hop host, not the device’s own address. community defaults to
"public". oids is the list of OIDs to poll each tick — raw dotted OIDs,
otto’s named bundles (otto-core, otto-net:N, otto-fs:N), or a mix of
both; see the snmp.oids field reference in Lab Configuration for the full
bundle syntax. Presentation (label, chart group, unit) is supplied by the
descriptor registry, not by lab data.
How otto reads SNMP data
SnmpClient (in otto.monitor.snmp) is a thin async SNMP v2c GET wrapper. It
issues a single GET PDU per poll tick for all configured OIDs and returns a
{oid: float | None} mapping. The pysnmp library is imported lazily inside
SnmpClient.get, so the SNMP path is entirely optional — otto imports cleanly
without pysnmp installed, and unit tests can mock at the get boundary.
Built-in metric descriptors
Otto ships descriptors for a standard OID set. Each descriptor (an SnmpMetric)
carries the label, chart group, y-axis title, unit, tab, and a scale factor
that converts the raw integer varbind to a real value.
OID |
Label |
Chart |
Unit |
Notes |
|---|---|---|---|---|
|
Uptime |
Uptime |
s |
Standard |
|
Overall CPU |
CPU |
% |
Otto enterprise OID (centi-percent ÷ 100) |
|
Heap Used |
Memory Usage |
B |
Otto enterprise OID |
|
Heap Free |
Memory Usage |
B |
Otto enterprise OID |
|
Threads |
Threads |
— |
Otto enterprise OID |
The enterprise OIDs are served by otto’s Zephyr test-bed agent. The enterprise
base is 1.3.6.1.4.1.63245 (PEN 63245, a placeholder — a real IANA PEN has not
yet been assigned).
kind governs how a raw varbind becomes a chart point: gauge (the
default, e.g. Heap Used above) charts raw * scale directly; counter
treats the varbind as a monotonic counter and converts it to a per-second
rate — first sighting and post-reboot re-baselining emit nothing, the same
rule the Unix Network I/O/Disk I/O parsers follow (see
Built-in metrics).
Per-interface and per-filesystem OIDs
Network and filesystem metrics live in an indexed subtree rather than a
handful of fixed leaves: a small agent has a known, fixed set of interfaces
and filesystems, 0-indexed by the firmware, and otto polls one scalar per
value with a plain GET — no table walk. This layout is the
firmware/manager contract: the agent and otto must agree on it exactly,
the same way both sides agree on the core .1 scalars above.
OID |
Leaf |
Kind |
Notes |
|---|---|---|---|
|
rx bytes |
counter |
Charted as |
|
tx bytes |
counter |
Charted as |
|
rx packets |
counter |
Rides the rx-bytes series’ hover meta, not its own chart. |
|
tx packets |
counter |
Rides the tx-bytes series’ hover meta. |
|
rx+tx errors (combined) |
counter |
Charted as |
|
drops |
counter |
Charted as |
|
filesystem used bytes |
gauge |
Charted as |
|
filesystem total bytes |
gauge |
Rides the used-bytes series’ hover meta as a human-readable total, not its own chart. |
<i> is the interface or filesystem index (0, 1, …). The generated
labels above (rx if0, fs1 used, …) come from the same descriptor
registry as the core scalars, so they can be renamed per device — see
Extending: registering custom descriptors
below. Lab data never spells out these OIDs directly; the otto-net:N /
otto-fs:N bundles (see Lab Configuration) expand them and register their
descriptors together.
An OID present in oids but without a registered descriptor falls back to
default styling via resolve_snmp_metric: the OID string is used as the label
and chart name on the generic metrics tab, so a host can poll a bare OID with
zero code and still get a chart.
Extending: registering custom descriptors
Register a descriptor for a private or device-specific OID from an init module
listed in .otto/settings.toml:
from otto.monitor.snmp import SnmpMetric, register_snmp_metric

register_snmp_metric(
    SnmpMetric(
        oid='1.3.6.1.4.1.99999.1.5.0',
        label='Fan Speed',
        chart='Fan',
        y_title='RPM',
        unit='rpm',
        tab='fans',
        tab_label='Fans',
        scale=1.0,
    )
)
This follows the same extension pattern as register_host_parsers and
register_command_frame. The SnmpMetric fields are oid, label,
chart, y_title, unit, tab, tab_label, and scale; everything
after chart has a default, so a private OID only needs the first three:
>>> from otto.monitor.snmp import SnmpMetric
>>> m = SnmpMetric(oid='1.3.6.1.4.1.99999.1.5.0', label='Fan Speed', chart='Fan',
...                y_title='RPM', unit='rpm', tab='fans', tab_label='Fans')
>>> m.tab, m.tab_label, m.scale
('fans', 'Fans', 1.0)
>>> SnmpMetric(oid='1.2.3', label='X', chart='C').tab
'metrics'
register_snmp_metric always overwrites, so the same call renames a
built-in descriptor too — including the auto-generated per-index labels
from Per-interface and per-filesystem OIDs
(rx if0, fs1 used, …): register a new SnmpMetric for that exact OID
with a more meaningful label (e.g. rx wan0) and it replaces the default.